Sixty reports built in
Common nonprofit reports are ready on day one.
Start with ready-made reports, build your own with drag and drop, and put what matters on a dashboard everyone can see.
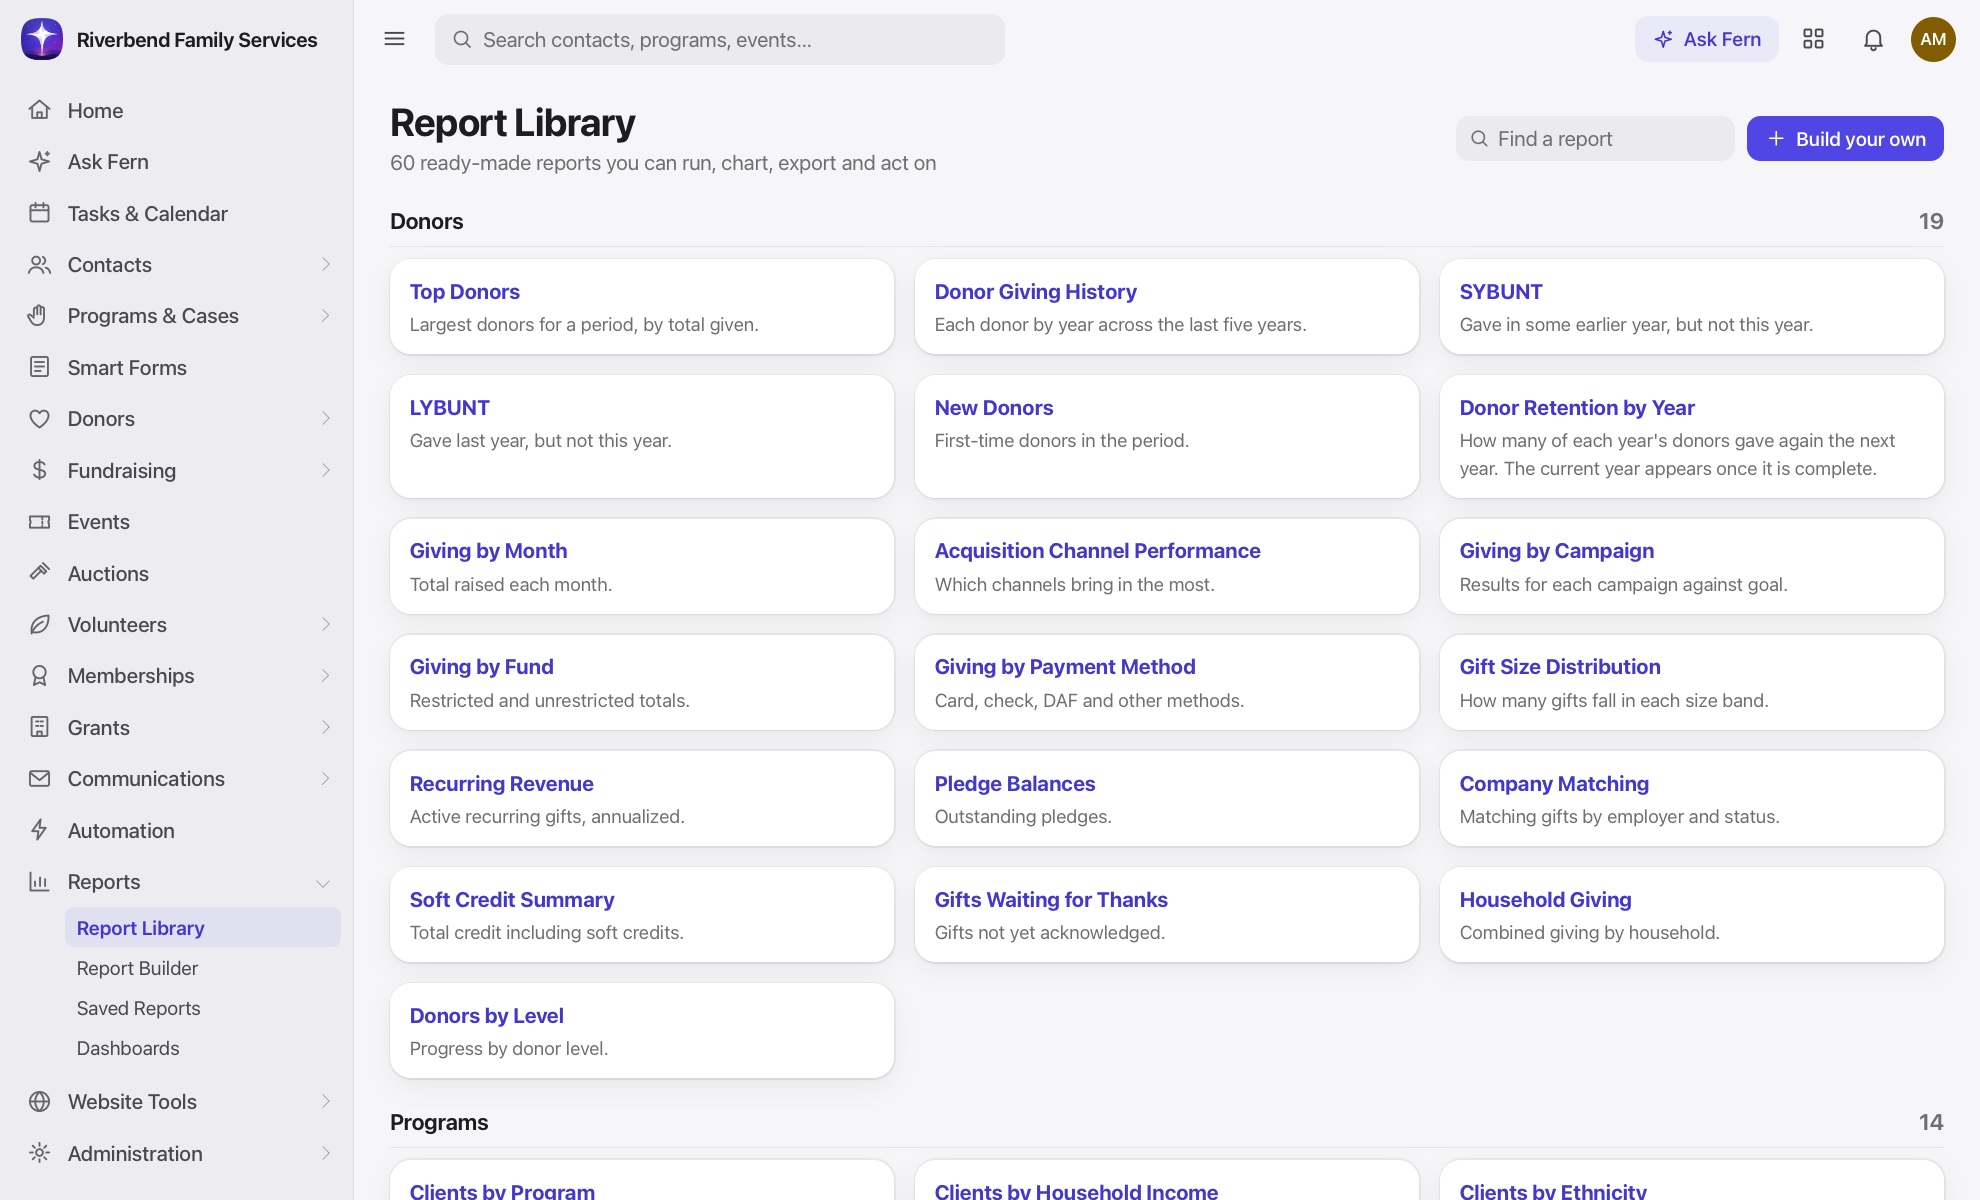
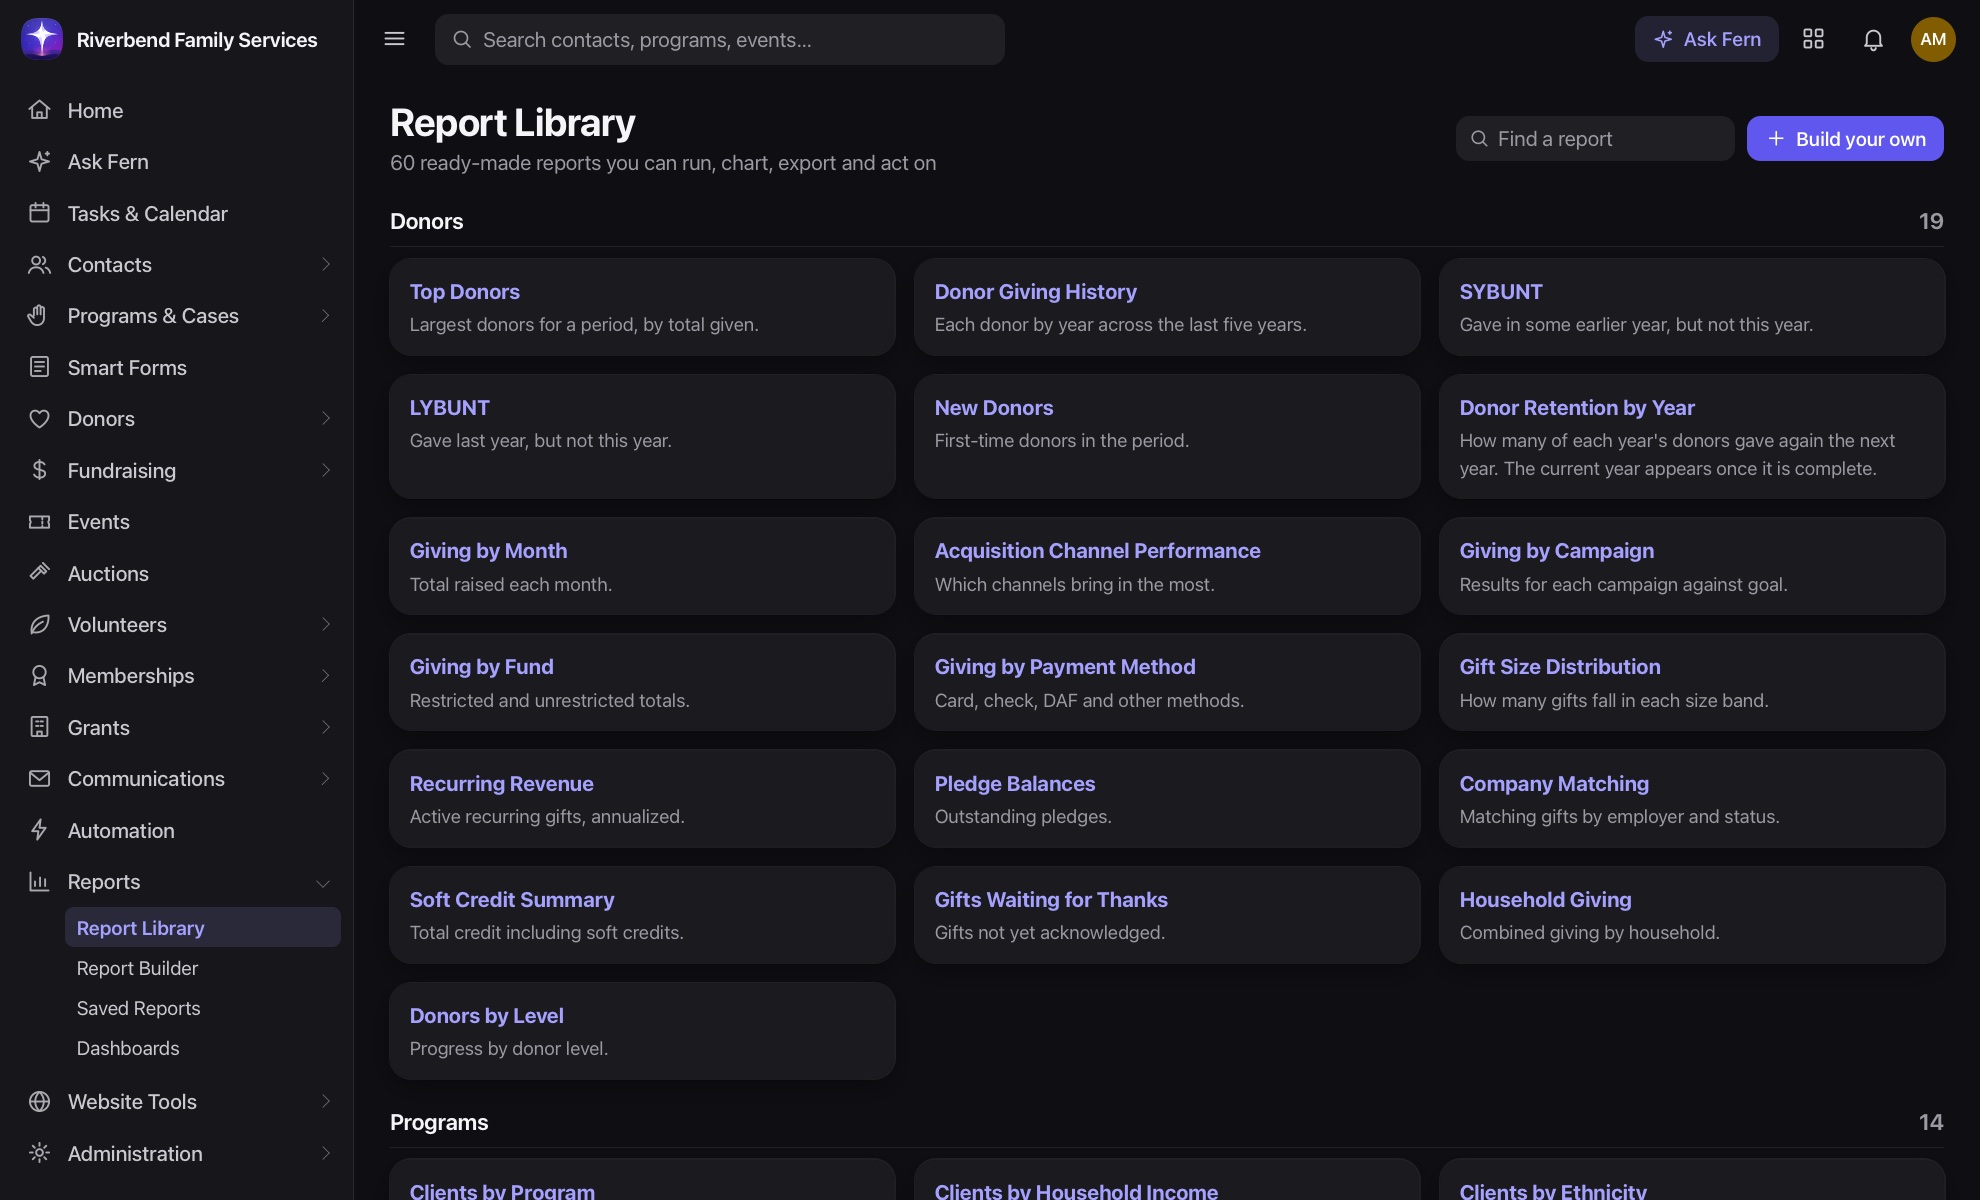
Common nonprofit reports are ready on day one.
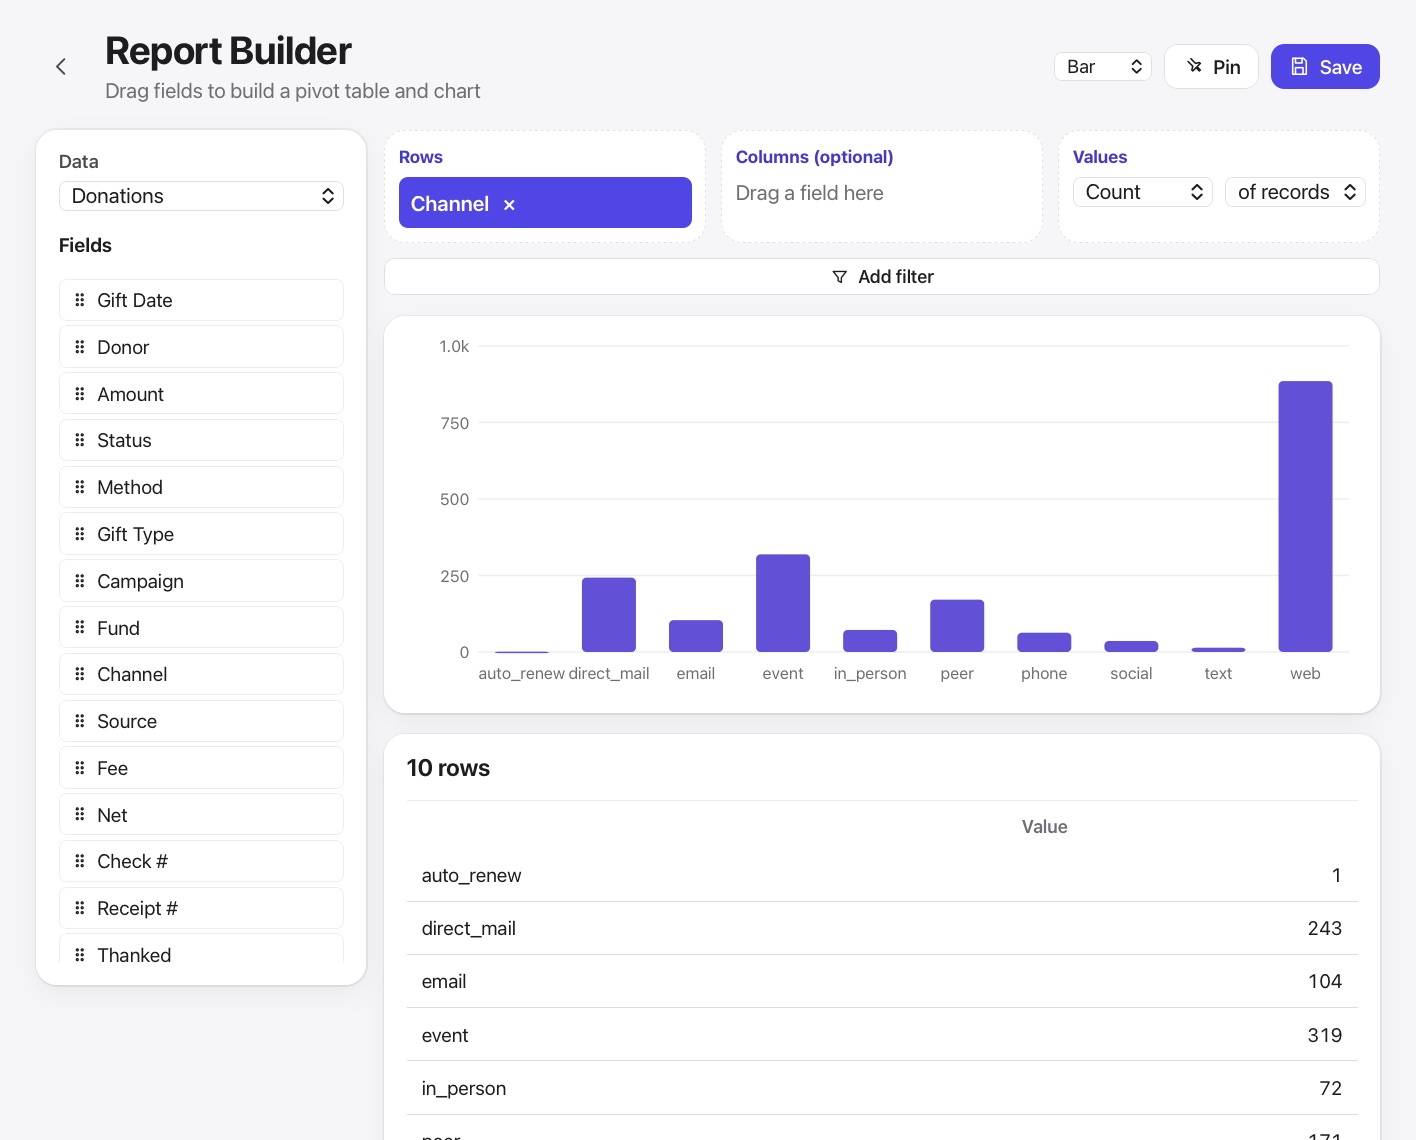
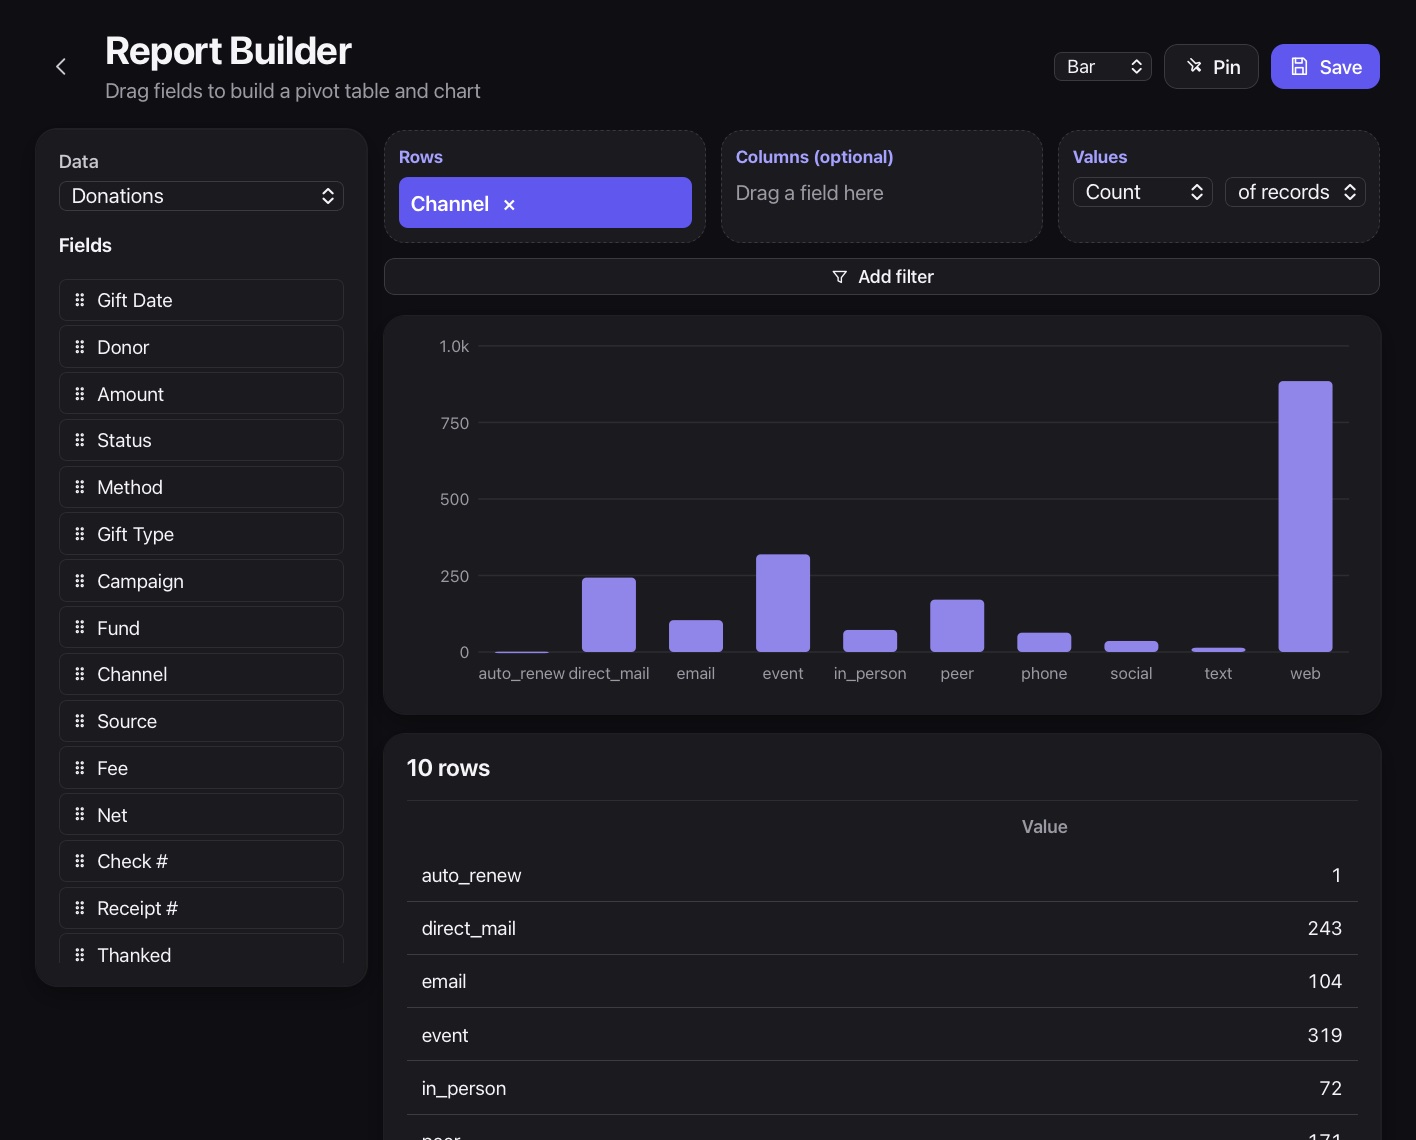
Drag fields into a chart or pivot table.
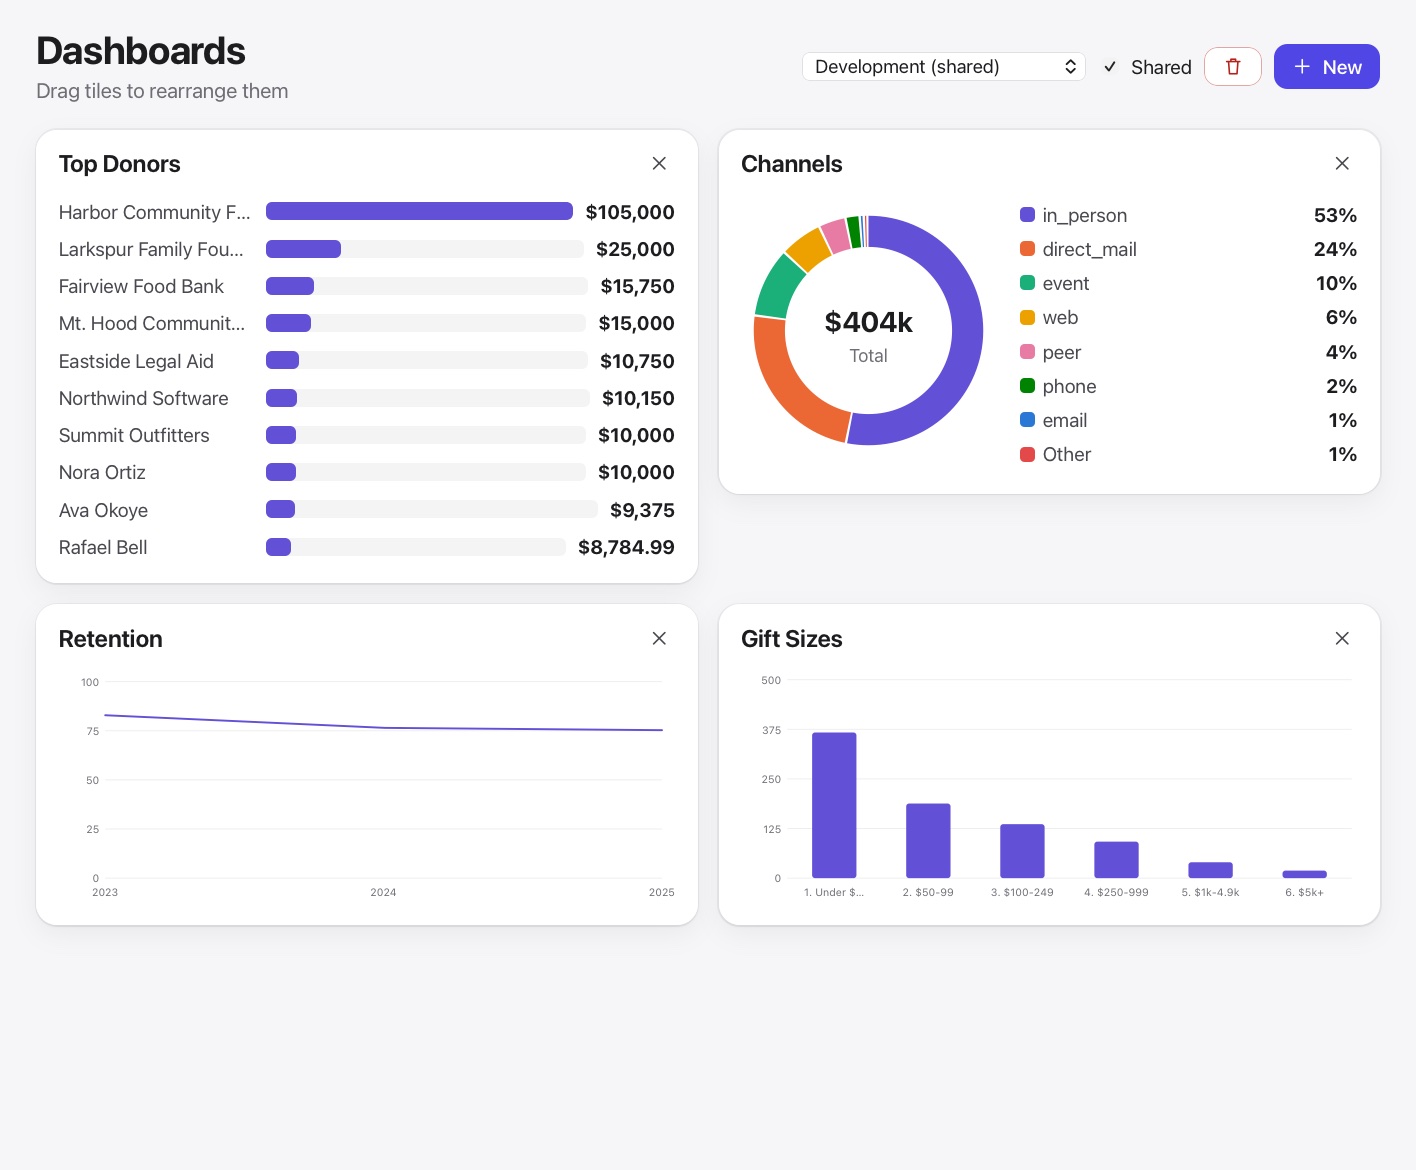
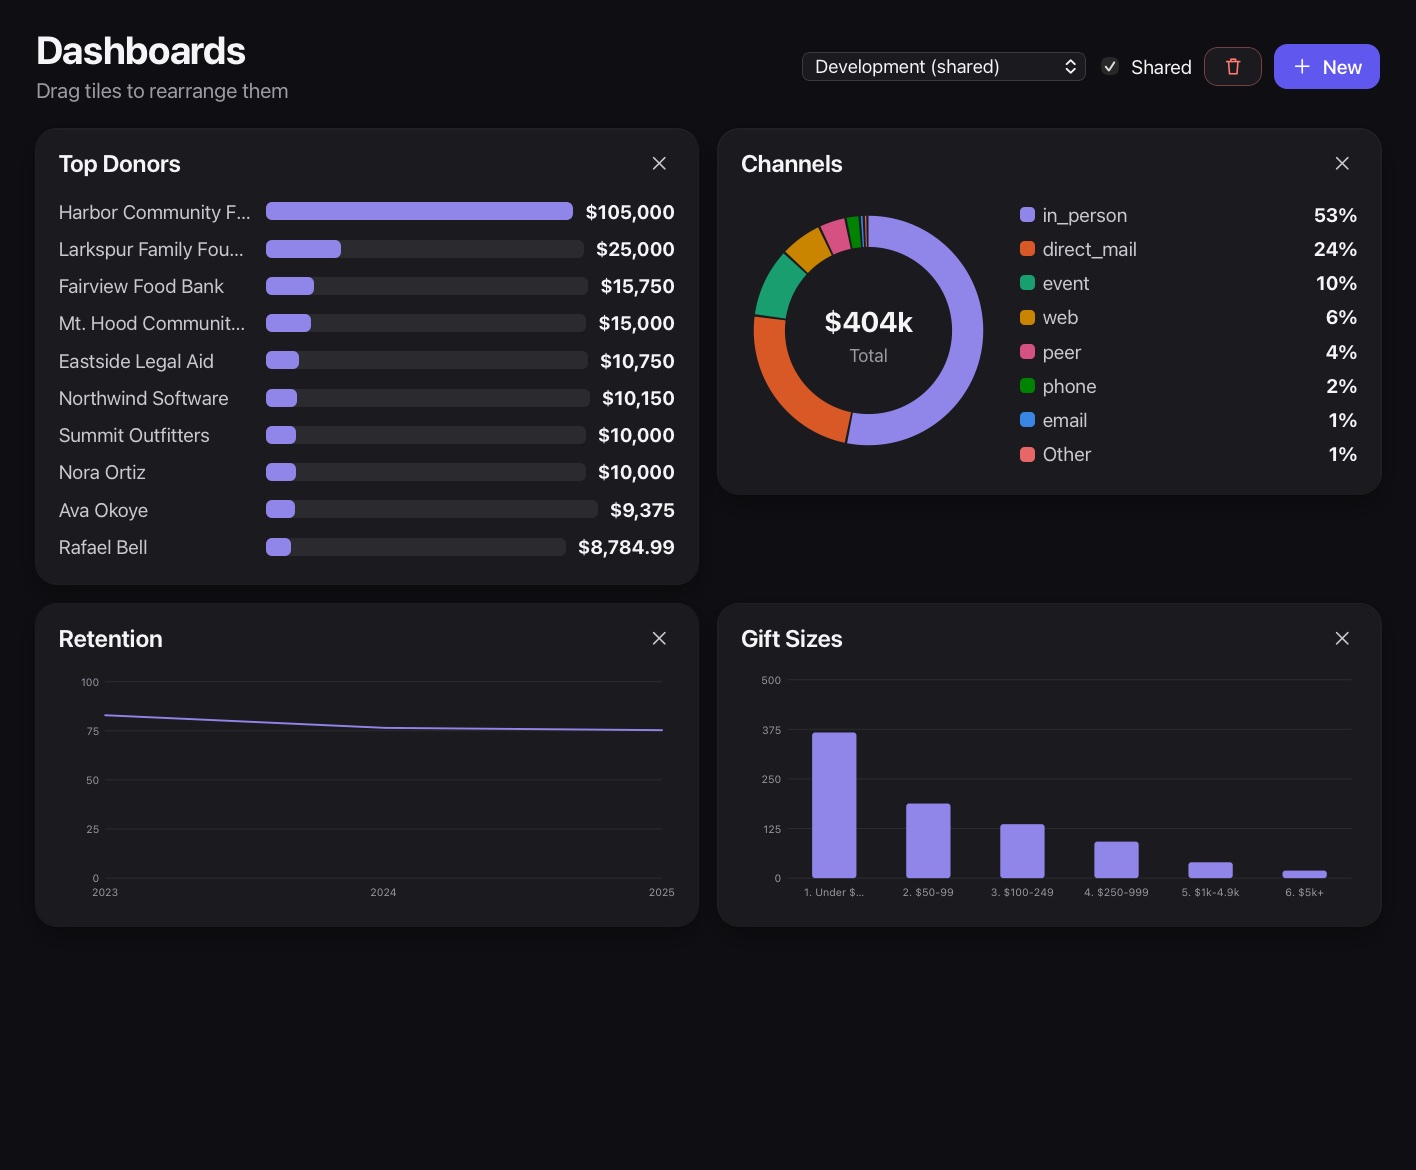
Save reports, pin them to dashboards and export to CSV.
Giving, programs, events, volunteers and grants all have reports waiting, with filters you can save.
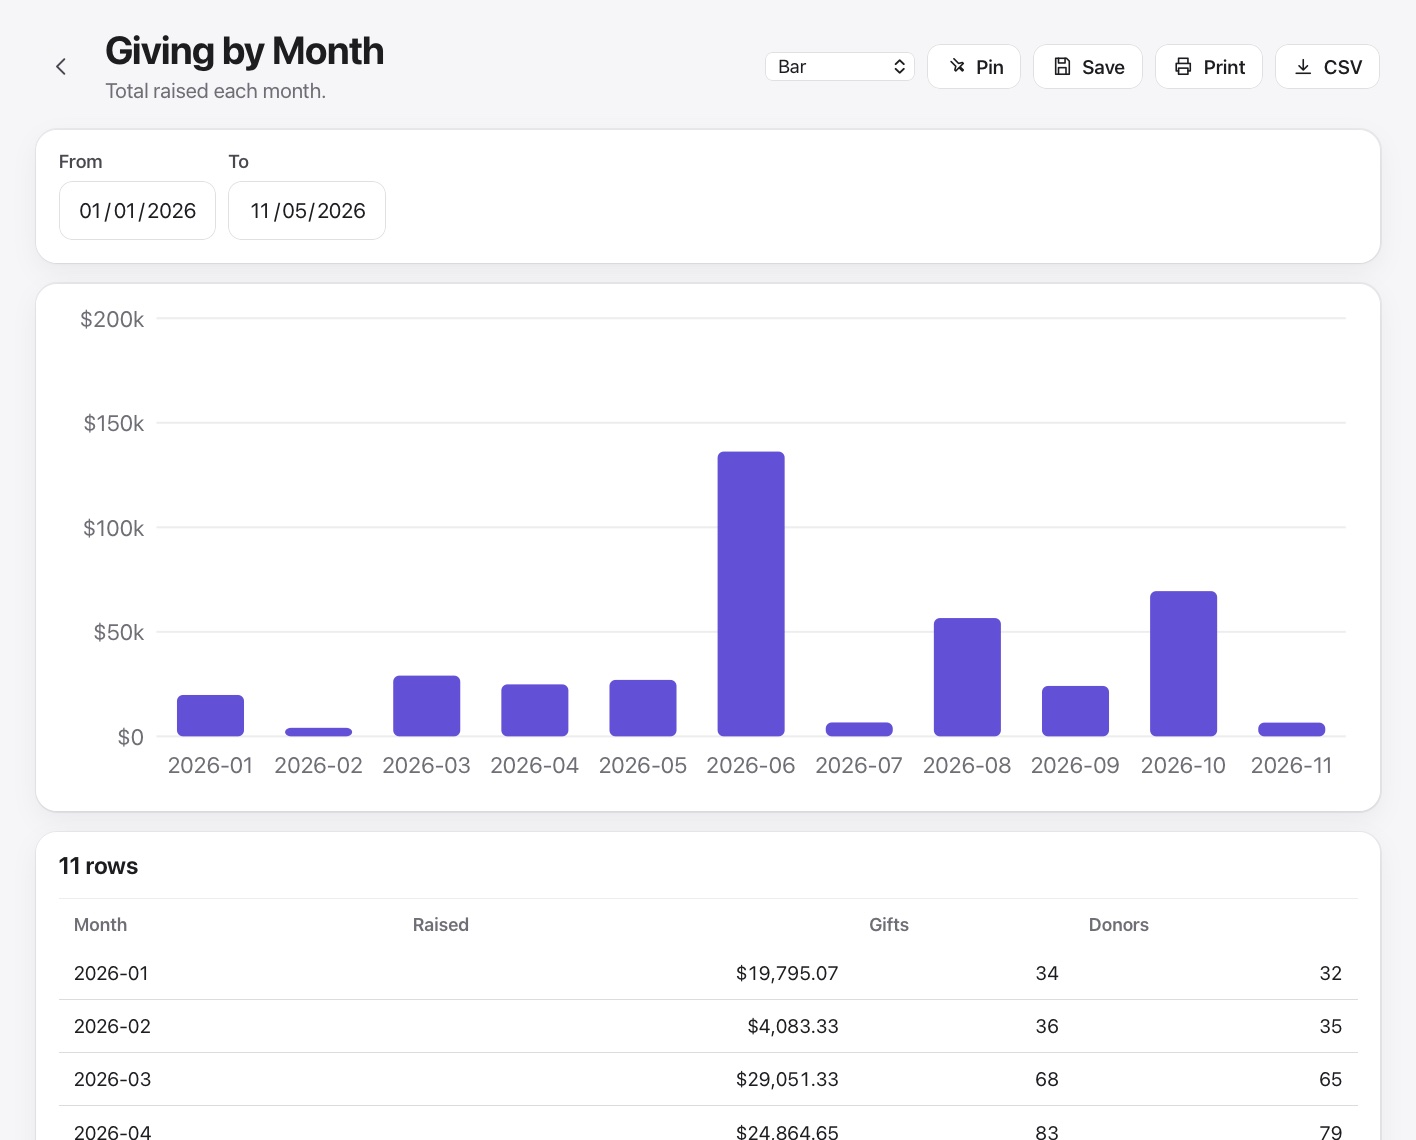
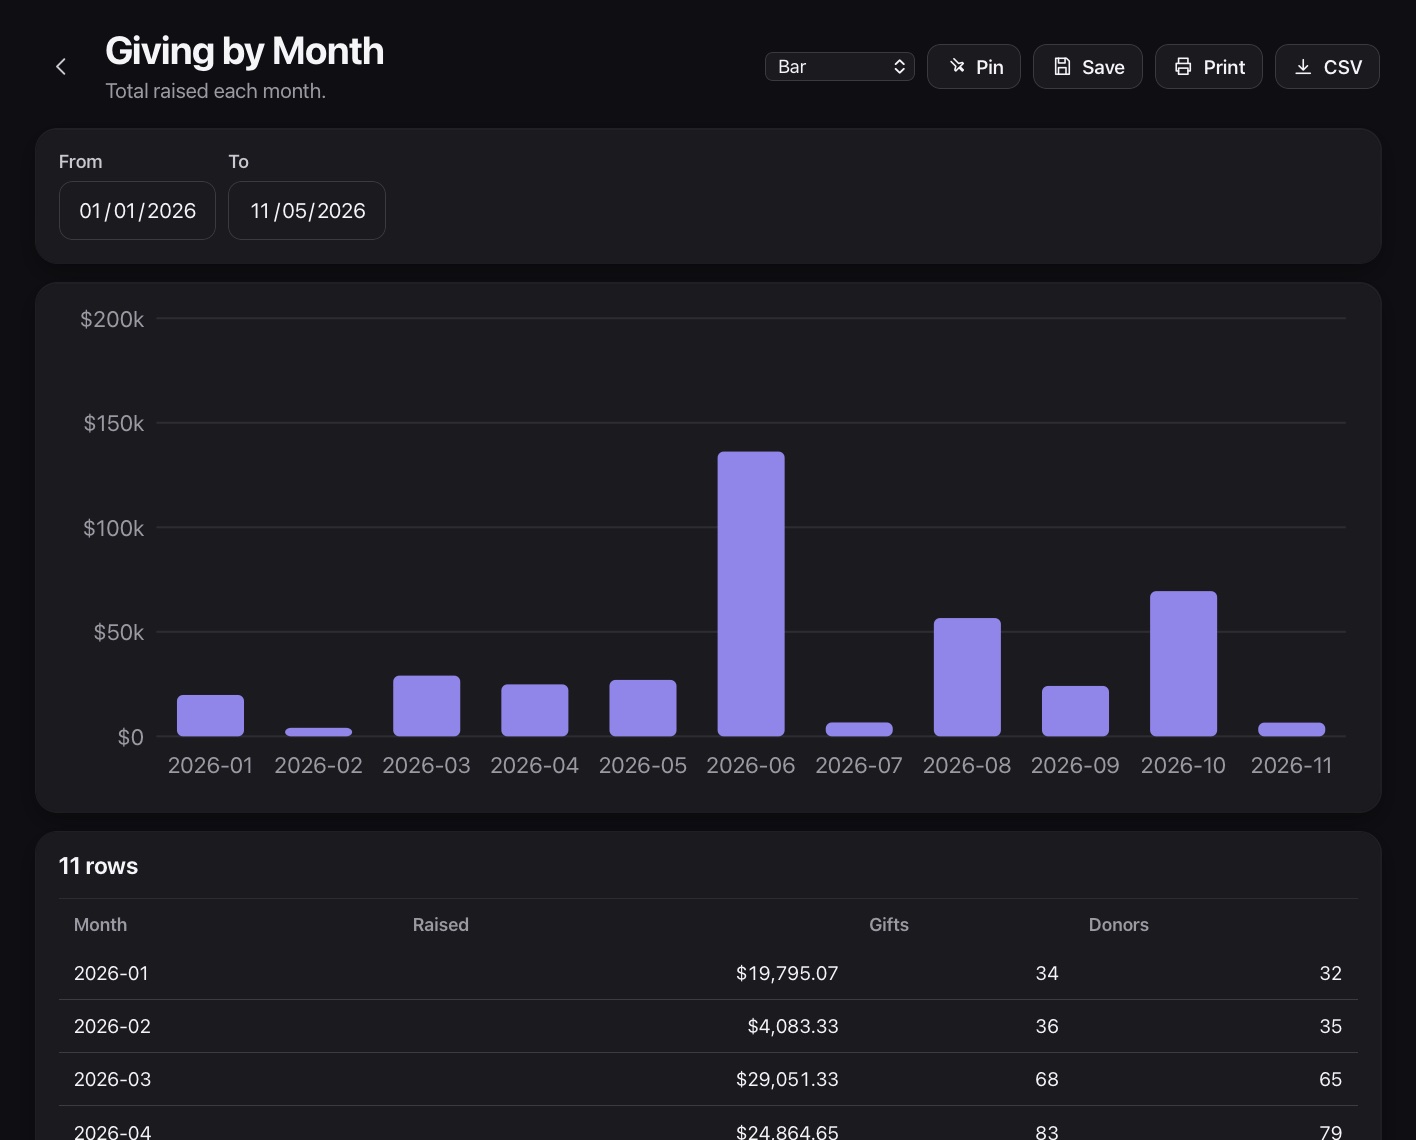
Drop fields into rows, columns and values, and watch the result appear.
Give your board, your development team and your program leads their own view of what matters.
It all runs on one shared record, so nothing has to be entered twice.
Yes. The builder needs no technical skills, and reports can be saved and shared.
Yes. Reports export to CSV.

A real person will walk you through Missionly using the way your organization already works.